
A Phoenix Strategy Group product
Stop guessing.
Start growing.
Know what’s working, what isn’t, and who owns it, every week instead of weeks too late.
On desktop and on your phone. Connects to QuickBooks, Xero and more. Already a customer? Sign in.
Company Overview
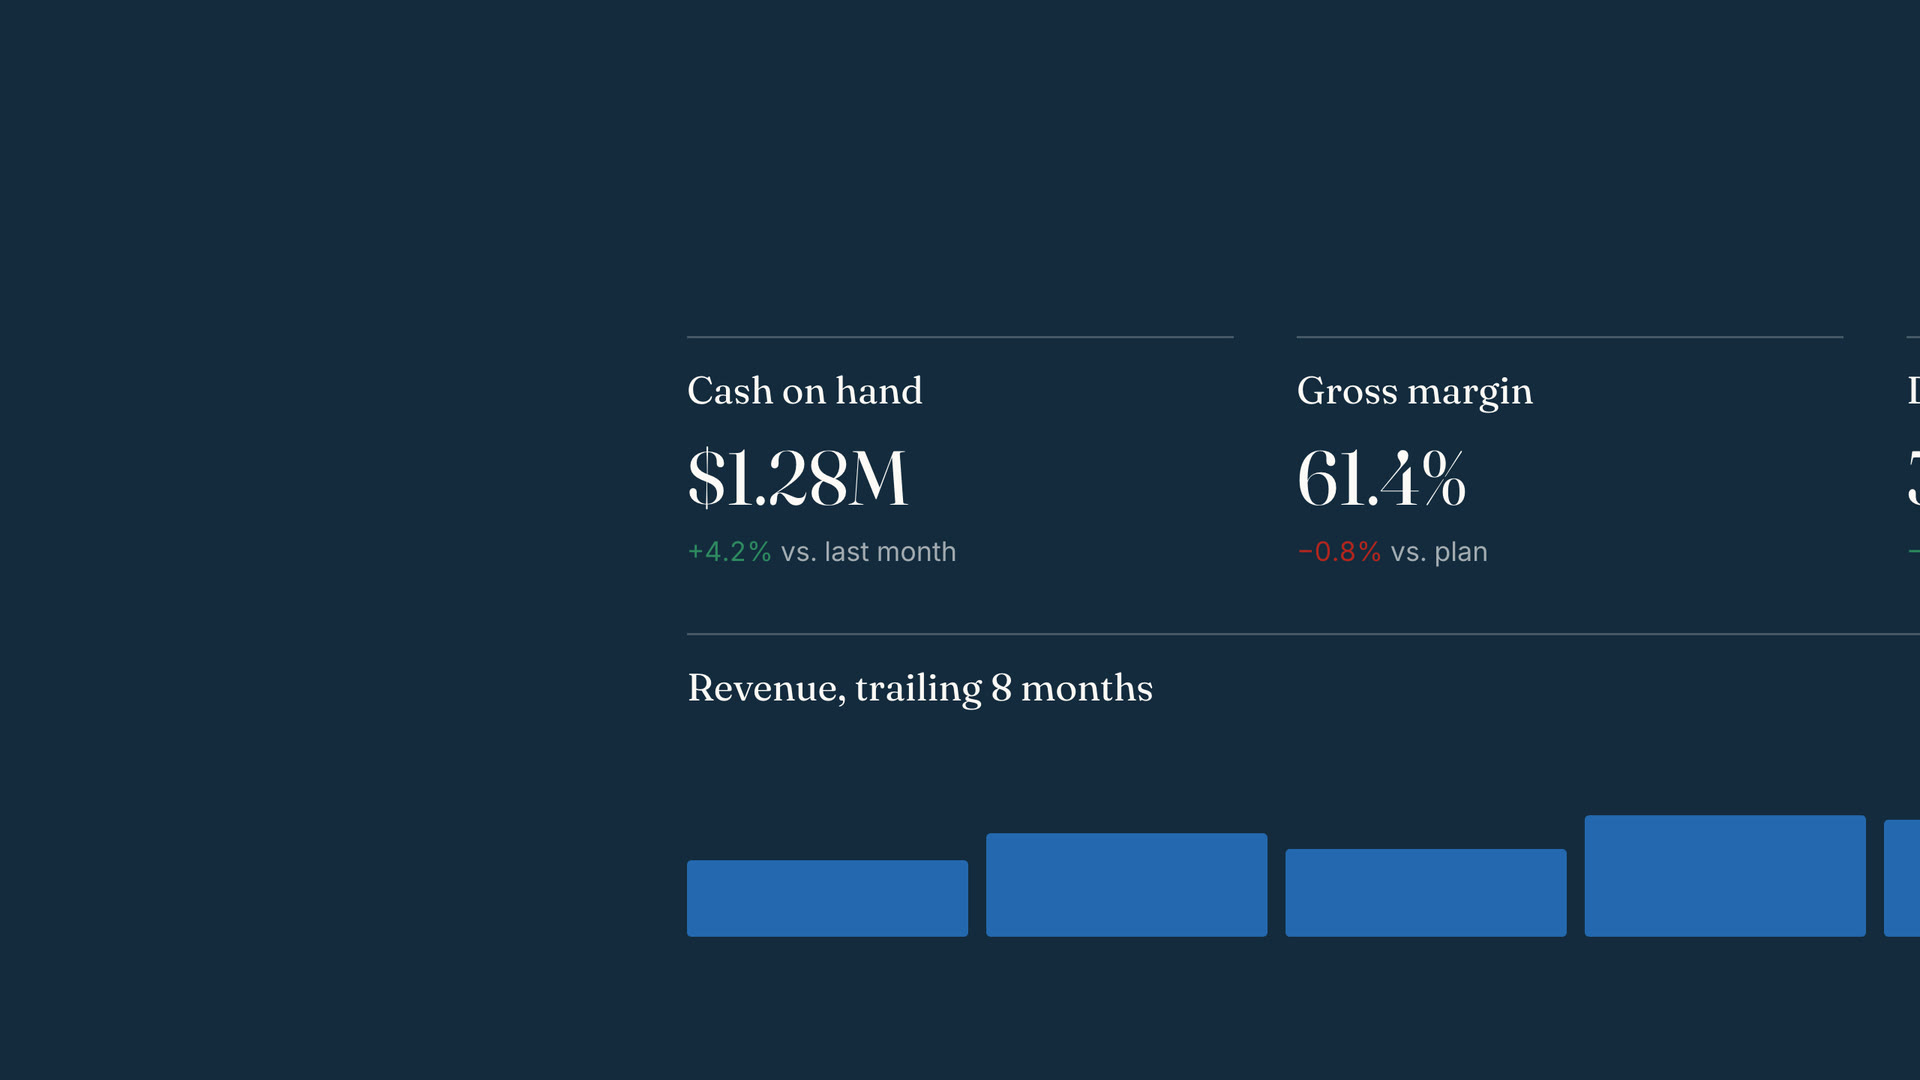
Cash on hand
$1.28M
+4.2% vs. last month
Job margin
34.1%
−3.9 pts vs. plan
Revenue, actual vs plan
Actual Plan ForecastQ3 $1.53M +0.6%Q4 forecast
$1.72M
vs. plan
+4.9%
Range
±$81K
Hartwell fit-out is over budget.
Labour +$18K · Materials +$7K · 3 of 14 jobs over
Why did margin slip in August?
Gross margin was 61.4%, 0.8 pts under plan. Two cost lines explain almost all of it:
Over plan, August
- Direct labour+$18K
- Materials+$7K
Labour ran over on overtime in the second half of the month.
Law firms. Labs. Manufacturers. Travel. The team behind companies across 40+ industries.




















Today
Too many spreadsheets. Not enough answers.
Your numbers live in five different places. The one spreadsheet that ties them together makes sense to one person. And by the time anyone sees last month’s results, it’s too late to change them.
| A | B | C | D | E | F | G | H | |
|---|---|---|---|---|---|---|---|---|
| 1 | P&L + KPIs: 8 qtrs actual + 4 fcst | |||||||
| 2 | USD thousands unless noted | |||||||
| 3 | Metric | Q1 FY26 | Q2 FY26 | Q3 FY26 | Q4 FY26 | Q1 FY27 | Q2 FY27 | Q3 FY27 |
| 4 | Status | Actual | Actual | Actual | Actual | Forecast | Forecast | Forecast |
| 5 | Revenue | 2,145 | 2,318 | 2,502 | 2,689 | 2,884 | 3,061 | 3,240 |
| 6 | Gross margin | 60.9% | 61.4% | 61.6% | 61.6% | 61.7% | 61.7% | 61.8% |
| 7 | Net Operating Income | 266 | 336 | 389 | 443 | 494 | 543 | 593 |
| 8 | Ending cash | 7,902 | 7,851 | 7,824 | 7,803 | 7,981 | 8,302 | 8,744 |
| 9 | Leads | 1,020 | 1,080 | 1,140 | 1,171 | 1,260 | 1,330 | 1,400 |
| 10 | Win rate | 27% | 26% | 25% | 24% | 25% | 26% | 27% |
| 11 | New customers | 52 | 55 | 57 | 55 | 60 | 64 | 68 |
| 12 | Job margin | 39.4% | 38.1% | 36.9% | 35.7% | 37.0% | 38.0% | 38.5% |
| 13 | Labour hours vs estimate | +1.2% | +2.0% | +3.1% | +3.4% | 0.0% | 0.0% | 0.0% |
What this costs you
- Too many spreadsheets, and none of them agree
- Missing the numbers you actually need
- You see the results weeks after the month is over
1 · Plan
A plan built on your real numbers.
Tell us where you want the business to be. Dear CFO starts from what actually happened (sales, costs and cash, pulled from the software you already use) and lays out, month by month, what it takes to get there. As each month ends, the plan updates itself.
Fed by
| Line | Forecast formula | Actuals | Forecast | Qtr | ||||
|---|---|---|---|---|---|---|---|---|
| Jun | Jul | Aug | Sep | Oct | Nov | Total | ||
| Revenue | 2,254 | 2,286 | 2,318 | 2,400 | 2,472 | 2,548 | 7,420 | |
| Leads | PREV(1) * 1.04 | 368 | 391 | 412 | 428 | 445 | 463 | 1,336 |
| New customers | Leads * 4.6% | 18 | 18 | 19 | 20 | 20 | 21 | 61 |
| Gross Profit | 1,379 | 1,401 | 1,424 | 1,475 | 1,521 | 1,569 | 4,565 | |
| Gross margin | 61.2% | 61.3% | 61.4% | 61.5% | 61.5% | 61.6% | 61.5% | |
| Billable hours | PREV(1) * 1.03 | 5,980 | 6,040 | 6,120 | 6,304 | 6,493 | 6,688 | 19,485 |
| Job margin | PREV(1) + 1% | 37.2% | 35.8% | 34.1% | 35.1% | 36.1% | 37.1% | 36.1% |
| Net Operating Income | 407 | 422 | 443 | 461 | 480 | 501 | 1,442 | |
2 · Monitor
Know every week if you’re on track.
Lock in the plan as your target. From then on your results are checked against it automatically, and when something falls behind, Dear CFO tells you, with the reason attached.
| Reporting Tool | This Month to Budget | This Quarter to Budget | ||||||
|---|---|---|---|---|---|---|---|---|
| Sep-26 | Sep-26 | 3Q26 | 3Q26 QTD* | |||||
| Line | Budget | Actual | Diff. | % | Budget | Actual | Diff. | % |
| Profit & Loss | ||||||||
| Income | ||||||||
| Services | 512 | 476 | −36 | −7.0% | 1,536 | 1,400 | −136 | −8.9% |
| Total Income | 2,302 | 2,318 | +16 | +0.7% | 6,906 | 6,858 | −48 | −0.7% |
| Net Operating Income | 461 | 443 | −18 | −3.9% | 1,383 | 1,326 | −57 | −4.1% |
| Sales & Delivery | ||||||||
| New customers | 22 | 19 | −3 | −13.6% | 64 | 55 | −9 | −14.1% |
| Leads | 450 | 412 | −38 | −8.4% | 1,320 | 1,171 | −149 | −11.3% |
| Cost per lead | $125 | $118 | −$7 | −5.6% | $125 | $121 | −$4 | −3.2% |
| Job margin | 38.0% | 34.1% | −3.9 pts | −10.3% | 38.0% | 35.7% | −2.3 pts | −6.1% |
Gross margin is running under plan.
61.4%
−0.8 ptsagainst a plan of 62.2%What moved
- Direct labour+$18K vs. plan
- Materials+$7K vs. plan
3 · Hold accountable
Every goal has an owner.
Put a name on every number that matters: sales, margin, cash, hiring. Your team sees what they own and how they’re doing, so the weekly meeting is about fixing problems, not finding them.
Chief Executive
Dana Whitfield
On track
Profit & Loss › Income
Total Income+0.7%2,318,500 / 2,302,000
Head of Sales & Marketing
Marcus Okonkwo
Off track
Sales & Marketing
New customers−13.6%19 / 22
Sales & Marketing
Leads−8.4%412 / 450
Head of Delivery
Tobias Delacroix
Off track
Job Costing
Job margin−3.9 pts34.1% / 38.0%
Controller
Vacant
Also in the system
Ask a question. Get a straight answer.
Which customers grew fastest last quarter?
3 steps · 10.2s
Ridgeline Freight grew the most in absolute terms, adding $86K quarter over quarter. The top two account for 58% of the quarter’s growth.
Ask
Ask anything about your business.
Ask in plain English and get an answer from your own numbers. It shows how it got there.
Learn moreProfit & Loss
USD thousands| Account | Jun | Jul | Aug | Sep |
|---|---|---|---|---|
| Total Income | 2,254 | 2,286 | 2,318 | 2,400 |
| Gross Profit | 1,379 | 1,401 | 1,424 | 1,475 |
| Gross margin | 61.2% | 61.3% | 61.4% | 61.5% |
| Total Expenses | 972 | 979 | 981 | 1,014 |
| Net Operating Income | 407 | 422 | 443 | 461 |
Reports
Your monthly reports, already done.
Profit and loss, balance sheet and cash, always up to date from QuickBooks or Xero.
Learn moreWho it is for
Built for the people who run the business.
For operators
$1M–$25M businesses
Company Owner
Run the business on numbers you trust, a plan you set, and a team that owns its part.
- Know how last month went in the first week
- See a cash crunch coming before it hits
- Make decisions on facts, not gut feel
For investors
Portfolio oversight
Private Equity Firm
See every company the same way, and step in weeks before a quarter slips.
- Every company measured the same way
- Spot a company slipping in weeks, not quarters
- Ask about any company in plain English
A DAY WITH DEAR CFO
A DAY WITH DEAR CFO · 7:04 AM
Your accounting, sales and payment software updated while you slept, so you start the day with yesterday’s numbers, not last month’s.
- 11:14 PMQuickBooks1,284 transactions
- 1:02 AMStripe318 charges, 12 refunds
- 2:47 AMHubSpot96 deals updated
- 4:20 AMShopify441 orders
- 5:38 AMGoogle Ads14 campaigns
Cash on hand, as of 7:04 AM
$1.28M
+$52K since yesterday
A DAY WITH DEAR CFO · 9:22 AM
Ask the way you’d ask your finance person. It shows how it got the answer, so you can check it rather than take it on trust.
Which customers grew fastest last quarter?
3 steps · 10.2s
Ridgeline Freight grew the most, adding $86K quarter over quarter.
A DAY WITH DEAR CFO · 2:10 PM
When something slips behind plan, you hear about it the same day, with the reason already attached.
Gross margin is running under plan.
61.4%
−0.8 ptsagainst a plan of 62.2%What moved
- Direct labour+$18K vs. plan
- Materials+$7K vs. plan
A DAY WITH DEAR CFO · 5:45 PM
Results, plan and what changed, ready for your partners, your lender or your board. No weekend lost to spreadsheets.
- Profit & Loss, current to this afternoon
- Forecast through Q2, against plan
- Commentary on the three lines that moved
Dear CFOApp5:45 PM
September pack is ready. Revenue $2.32M, ahead of plan. Gross margin 61.4%, under by 0.8 pts, and direct labour is the whole of it.
Board pack · September · updates as the numbers move
How it works
No more copying and pasting.
Dear CFO connects to the software you already use and keeps it all in one place, updated automatically.


Live statements
P&L and balance sheet, current
Your metrics
Defined once, kept current
Answers
Ask in plain English
Industries
Set up for how your industry works.
Across the portfolio
Every company, one page.
Every company measured the same way, so you can see at a glance which one needs your attention.
Portfolio Protector for private equity| Company | Cash, mo. | Margin | YoY |
|---|---|---|---|
| Harborview Freight | 11.4 | 19.1% | +21.0% |
| Ironwood Logistics | 14.8 | 22.7% | +28.3% |
| Foxglove Creamery | 3.1 | 4.2% | −2.8% |
| Larkspur Robotics | 5.4 | 8.1% | +3.1% |
Watch
Two minutes, end to end.
Who builds it
Built by the people who do this work.
Dear CFO is built by Phoenix Strategy Group, the finance team growing companies call when the numbers have to be right. It is the system we run our own clients on.
Operating since 1998
Led by David Metzler, John Zdanowski and Ethan Lu
If you want to sleep better at night, hire Phoenix Strategy Group.
 Patrick WallainFounder / CEO, ABLEMKR
On Phoenix Strategy Group’s CFO work
240+
Portfolio companies
100+
M&A transactions
$200M+
Raised, last 12 months
5+
IPOs
Built by CFOs
Our finance team sets it up with you on a call, so it starts from how your business actually runs.
We never change your books
Dear CFO only reads from your software. It can’t change anything in it.
Your data stays yours
It belongs to you. Disconnect or delete it whenever you like.
See it with your own numbers.
Tell us a little about the business and we’ll get back to you to arrange a time.